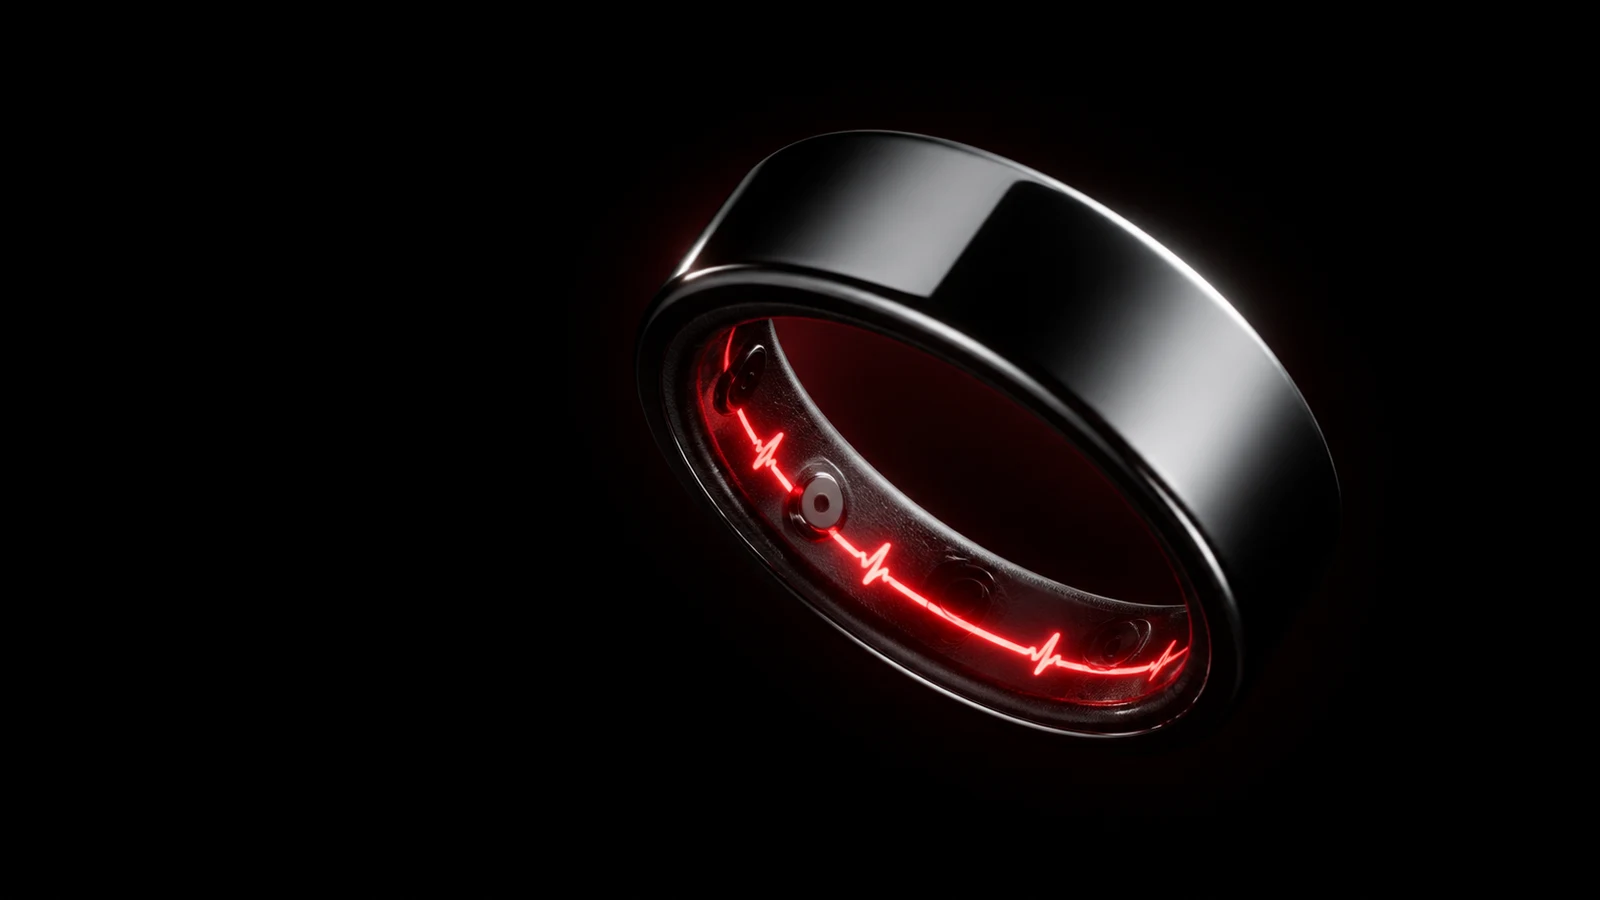
How to combine wearable data with blood work
How to compare wearable data with blood work, plus how Depth reads supported fitness and wellness records from Apple Health.
Depth Journal articles are educational, general-wellness content. They are not medical advice, diagnosis, or treatment.
 Raghav Dua Co-founder, Depth
 Imagine your Oura ring logs a 22% HRV drop on a Tuesday in March. Your blood panel, drawn the following week, shows hs-CRP at 2.1 mg/L, up from 0.6 the previous quarter. Most people would read those as two unrelated observations on two separate apps. Together, they suggest a question worth following: did the same change influence both? This guide is about how to compare wearable data with blood work on purpose, lining the two streams up so you can test a hypothesis instead of guessing from two fragments.
The limitations of wearables and blood tests in isolation
A wearable measures what your body is doing minute to minute. It reads resting heart rate, heart rate variability, sleep stages, and, with a CGM, glucose, every few minutes, all day, for as long as you wear it. What it cannot see is a single cellular marker. It does not know your ApoB, your fasting insulin, or your ferritin, because those live in your blood chemistry and a wrist sensor never touches your blood.
A blood panel is the mirror image. It counts lipoprotein particles and inflammatory proteins far more precisely than any wearable can, and it does it once a quarter. That is the catch: one frame every 88 or so days, blind to everything in between, where the behavior that actually moved the marker happened. A panel has near-perfect resolution in chemistry and almost none in time.
So each stream is half a sentence. The wearable says what your body is doing without saying what it costs you underneath; the blood says what it costs without saying what you did. The reason a single lab value has no direction, and the reason time is the join key that lets you line up two streams measured on different scales, is the whole argument that your body is a time series. This guide takes that as given and gets to the procedure.
Here is what combining buys you, stated plainly. A wearable trend that looked flat gets context. A biomarker that was quietly drifting gets a possible daily influence to investigate. The rest of this guide is the procedure to get there.
Step 1: Establishing your wearable baseline metrics
Before you read any single day against your wearable, collect two to four weeks of continuous data. A reading only means something against a reference, and the reference that matters is your own normal, not the population band the app ships with. You act on the slope, not on whether a single reading cleared a printed cutoff, and a slope needs a baseline to slope away from.
Four signals are worth baselining, because each one has a job:
- Resting heart rate can reflect cardiovascular load and recovery. It may climb when you are under-recovered, fighting something, or sleeping badly.
- Heart rate variability is a useful day-to-day signal. It reflects autonomic nervous system activity and may drop before you feel run down.
- Sleep stages, deep sleep especially, estimate overnight recovery. Total hours are coarse; stage estimates add context.
- Glucose, via CGM if you have one, shows your real metabolic response to the meals you actually eat, not the ones a textbook assumes.
Why the baseline matters: a resting heart rate of 58 bpm may be unremarkable for one person. If yours lives at 50 and has drifted up to 58 over six weeks, the change is worth investigating. Only the baseline shows that the number moved.
Baseline correctly or the rest collapses. Take HRV and RHR under the same conditions every time, on waking, before you are up and moving. Ignore single days; one bad night is noise. Watch the rolling average, because the line is the signal and any one dot is not. The output of this step is a personal range for each of the four signals, so that when you draw blood, you can tag the marker to what your body was doing that week.
Step 2: Pick the markers that pair with a wearable
Now pick the panel. The selection rule that makes this a combining guide and not a generic best-biomarkers list: choose markers that pair with a wearable signal, so every draw has a continuous stream to read against. A marker with no wearable counterpart is still useful, but it can only ever be a dot, never a line you can explain.
Four pairings cover most of what matters:
- Metabolic axis. Fasting insulin and HbA1c pair with your CGM and glucose trends. The CGM shows daily glucose changes; the blood markers add a longer-term view.
- Inflammation and recovery axis. hs-CRP pairs with sleep and HRV. When wearable recovery signals change, hs-CRP can add evidence about inflammation without identifying its cause.
- Cardiovascular axis. ApoB can be compared with training load and nutrition logs to test whether changes in diet or training coincide with the particle count.
- Fatigue. Ferritin pairs with HRV, RHR, and sleep when you are tired and the wearable shows no obvious behavioral explanation. Lower iron stores may be associated with fatigue or poorer recovery, but the pattern needs clinical follow-up rather than a diagnosis from the data alone.
These advanced markers earn their place because they move earlier than the standard dozen and because each has a wearable partner. The fuller case for putting ApoB, fasting insulin, hs-CRP, ferritin, and HbA1c on the panel is a post of its own; here it is enough to know they are the ones with continuous counterparts.
On cadence: quarterly is the working default, because four draws a year give you a slope rather than a dot. Align each draw to a representative week. Drawn the morning after a red-eye or a hard session, the panel tags your marker to a state you were in for one day, not the quarter you actually lived.
How to combine wearable data with blood work, step by step
You cannot average HRV and ApoB; they are not on the same scale and never will be. What they share is a timestamp. Every reading, the five-minute CGM value and the quarterly panel alike, carries a time. So you line both streams on one calendar and ask a single question: what else was true that week? Time is the join key. Three worked examples show the shape.
Metabolic. Suppose a ten-minute post-lunch walk is followed by a smaller CGM rise, down from 64 mg/dL to around 20. On the nights after lower-glucose days, your wearable may also show higher next-morning HRV and more deep sleep. That is an association to test, not proof that the walk caused either change. Fasting insulin and HbA1c at your next draw add a longer-term check.
Cardiovascular, with a lag. Your ApoB is up 17 points across three panels. Lined up on the calendar, the climb tracks saturated fat that rose on your heavy-training weeks. The timing makes diet one hypothesis to investigate, but it does not establish why ApoB moved.
Inflammation. hs-CRP creeps from 0.6 to 2.1 mg/L. On the wearable, that window lines up with a stretch of sub-six-hour sleep. The overlap is worth following, but neither signal identifies the cause of the other.
The rule all three share: one signal can strengthen or weaken a hypothesis about another. It cannot confirm cause. Look for a repeated pattern, change one behavior if it is safe to do so, and recheck the relevant signals. Discuss concerning or persistent changes with a qualified clinician.
Let software do the join for you
You can do a version of this by hand. A spreadsheet, a shared calendar, and an afternoon will line up a CGM trace against a panel and a sleep log. For two streams over one quarter, manual works. It gets harder at four streams on four scales, sampled at four rates, with quarter-long gaps between a behavior and a later reading. Those offsets are easy to miss when the table gets wide.
State the integration problem precisely. You have incommensurable streams: a quarterly timestamp, a five-minute CGM read, nightly sleep epochs, a per-session training-load number. They join on time, and then they have to be reasoned across. “This is because of that” is a claim about time, and something has to test it against the actual offsets, not assume it.
Apple Health is Depth’s only current health-data connection. Depth reads user-authorized fitness and wellness records from Apple Health and can place supported records alongside your bloodwork. If another app or device writes records to Apple Health, Depth may read those supported records from Apple Health; that does not make Oura, Apple Watch, WHOOP, a CGM, or any other hardware a direct Depth integration. Depth does not directly communicate with, control, or certify those devices.
The examples above remain useful ways to analyze exported or Apple Health-sourced data. In Depth, the output should be read as an observation or hypothesis, such as: “ApoB rose during the same period that saturated fat was higher on heavy-training days.” The Depth Score can summarize supported data, but it does not prove why a marker moved. Early access and the Founders Edition are available if that current Apple Health-based workflow fits your data.
The honest boundary: AI cannot create signal that is not there or turn an association into a diagnosis. It needs enough of your timeline to say anything, and when it has not seen enough, the right answer is “not yet, here is what we are watching.” The job of automation is to reduce the manual comparison and surface patterns worth checking.
Where this goes wrong
Five ways this goes wrong, each the inverse of a step above.
- Reading a single day against itself. One bad HRV morning or one glucose spike is noise. Act on the rolling trend, not the dot.
- Drawing blood on an unrepresentative day. A panel taken after a red-eye, a hard session, or a poor night tags the marker to a state you were not in all quarter. Hold conditions steady.
- Confusing correlation with cause. Two lines moving together can be coincidence or a shared third driver. Hedge in the verb, “appears to,” “tracks with,” and look for an independent signal before you change anything.
- Chasing population reference ranges instead of your own. The printed band describes a crowd; you are an N of one. A marker still inside “normal” but marching toward the edge is a finding, not a pass.
- Over-correcting on a wobble, and metric overload. More streams is not more signal if you cannot read them together. Add devices and you mostly add ghosts to chase.
The whole piece reduces to one action. Pick one wearable signal and one marker it pairs with. Line up your last few weeks of the signal against your last few draws of the marker on the same calendar. Read the two as one before you touch anything else. Do that once and the two dashboards collapse into a single read you can act on.
The intelligence layer
for your body.
Apple Health is Depth's only current health-data connection. Depth reads your bloodwork and user-authorized fitness and wellness data from Apple Health, then reasons across it to tell you what actually matters. Depth does not directly communicate with, control, or certify wearable or medical hardware.